Information required for application data:
- Type of analysis – standard is S1 (P, K, Mg and pH). Further nutrients can be added for an additional fee. Two popular additions are Ca and OM.
- Cropping – to create a fertiliser recommendation the decision support team require crop information, yield, target pH, muck information and straw policy.
- Once these reports have been created it is then time for a discussion with the grower and agronomist.
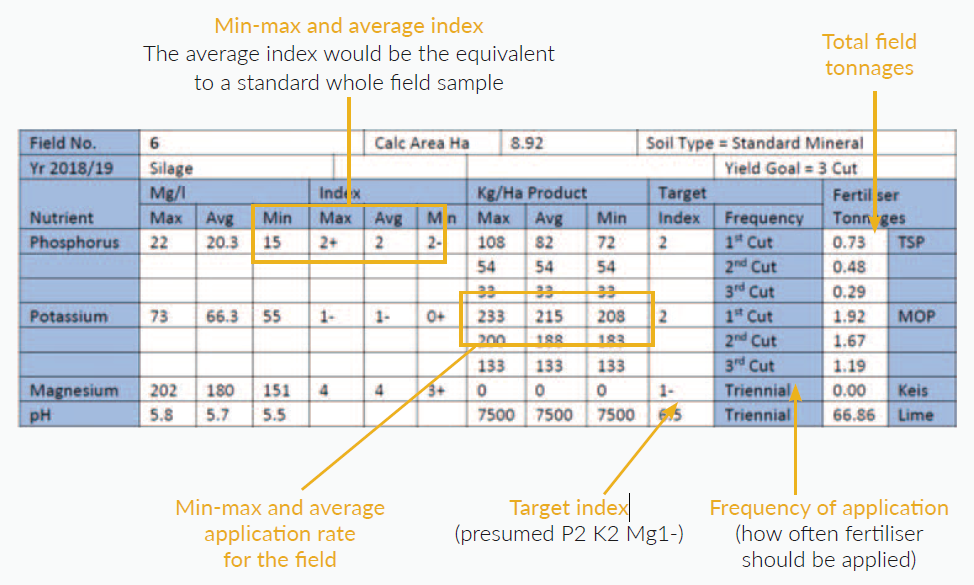
Key Points to view in the results table:
The cropping form should be updated yearly for new recommendations. Four years of recommendations are supplied with this service.
For a greater depth of knowledge, it is suggested that a broad spectrum Solvita analysis is carried out for the whole field.