
Biomass imagery highlights areas of low and high biomass within your crop using satellite-derived NDVI (normalised difference vegetation index) images that indicate how photosynthetic a crop is.
Multiple images are available throughout the season to track crop performance.
Service use
Biomass imagery is used to produce data on:
Variable rate nitrogen applications
Variable rate plant growth regulator (PGR) applications
Intelligent crop walking
Smart tissue analysis
Benefits
Yield increases of 3-5% using variable rate nitrogen
Variable rate nitrogen applications also help to reduce lodging risk
What is involved
Provide fields and locations for which you require maps
Let us know what fertiliser you are using
Let us know the preferred application rate
We’ll do the rest and provide you with all the data you need
Intelligent crop walking
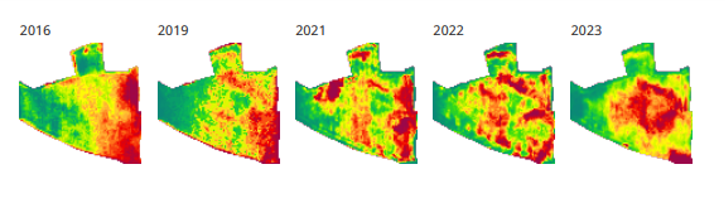
View and compare NDVI images to see how crops are performing throughout the season. Images can be viewed on an app.
Variable rate nitrogen
Variable rate nitrogen is a simple process. You enter the average rate you wish to apply to the field and enter the percentage variation from that figure you would like to use.
Our partner provides figures on the variability of your crop. You can change grid sizes to fit with equipment size and rotate grids to fit tramlines.
Variable rate nitrogen application is not designed necessarily to save money, but more to optimise fertiliser application according to crop need. The main benefit of the service is the optimal increase in yields that are achievable.
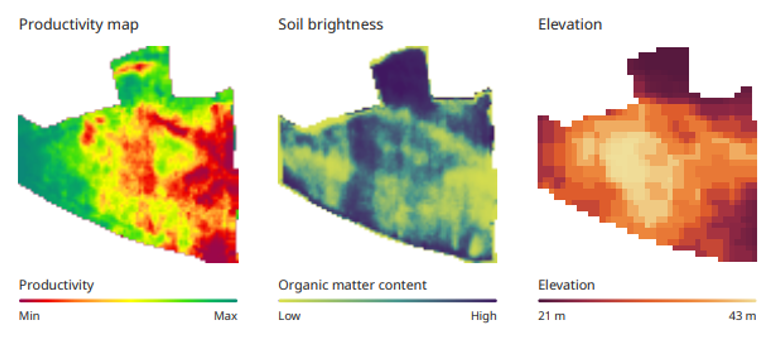
Productivity data from previous years
 Comparison of productivity zones