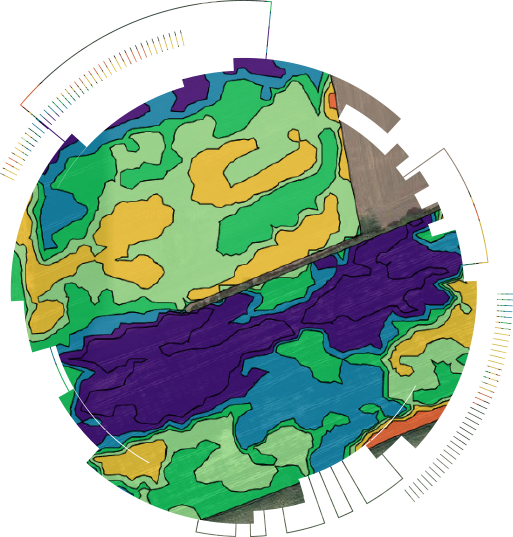
Yield map cleansing can provide a critical check to compare and contrast operations undertaken during the season, highlighting those approaches that have worked and pinpointing others that need further refinement.
Identifying this variation is key to understanding what is happening in the field. Yield map cleansing enables us to remove header lifts and combine turns and also take into account part swaths.
Service use
Overall crop view
Basic variable rate seed
Offtake variable rate P and K
Problem solving
Benefits
Better understand why areas are performing better or worse. Correct these issues for an increase in yield
Action variable rate seed from previous performance to even up the crop
Ensure indices do not drop
What is involved
Export your yield data from the combine
Send to your agronomist or precision specialist
Your precision specialist will process the data and send an overview of your fields back to you
A discussion can then take place and your precision specialist will advise you on next steps
Multiple years of yield data, which can be normalised (make all maps show the same figure) and layered together to identify trends and potential actions. For example, if an area always performs badly should it be put into an environmental scheme to make money rather than lose it? For most accurate results a minimum of three years of data should be used.
This data can be used to create basic seed maps, variable rate P and K based on offtake and to target soil sampling to understand variances better. Yield data can also be used to create profitability maps. All we need is the input costs of the land we are analysing.


