
Field productivity mapping looks at multiple years of biomass imagery, soil brightness and elevation imagery which are collated, providing an accurate productivity map which then becomes the blueprint to your variable rate seed prescription.
The main advantage of using satellite data over in-field sensors is that we can collect data regardless of the weather, crop, or time of year. Additionally, we can access data from up to seven years ago, which provides a more comprehensive representation of what truly happens within your field over a longer period. Combining multiple data layers over multiple years reveals common trends in a field, resulting in a productivity map.
For customers who already have in-field scanning data, such as EM, EC, or any other soil variation data, we can still use this information to create your prescriptions.
Service use
Variable rate seed
Benefits
P and K offtake more uniform
More consistent harvesting speed
Soil zones for variable rate P and K
Problem areas to place broad-spectrum Solvita samples
What is involved
Send the precision team your field locations. We request the data from the satellites and provide you with a variation map
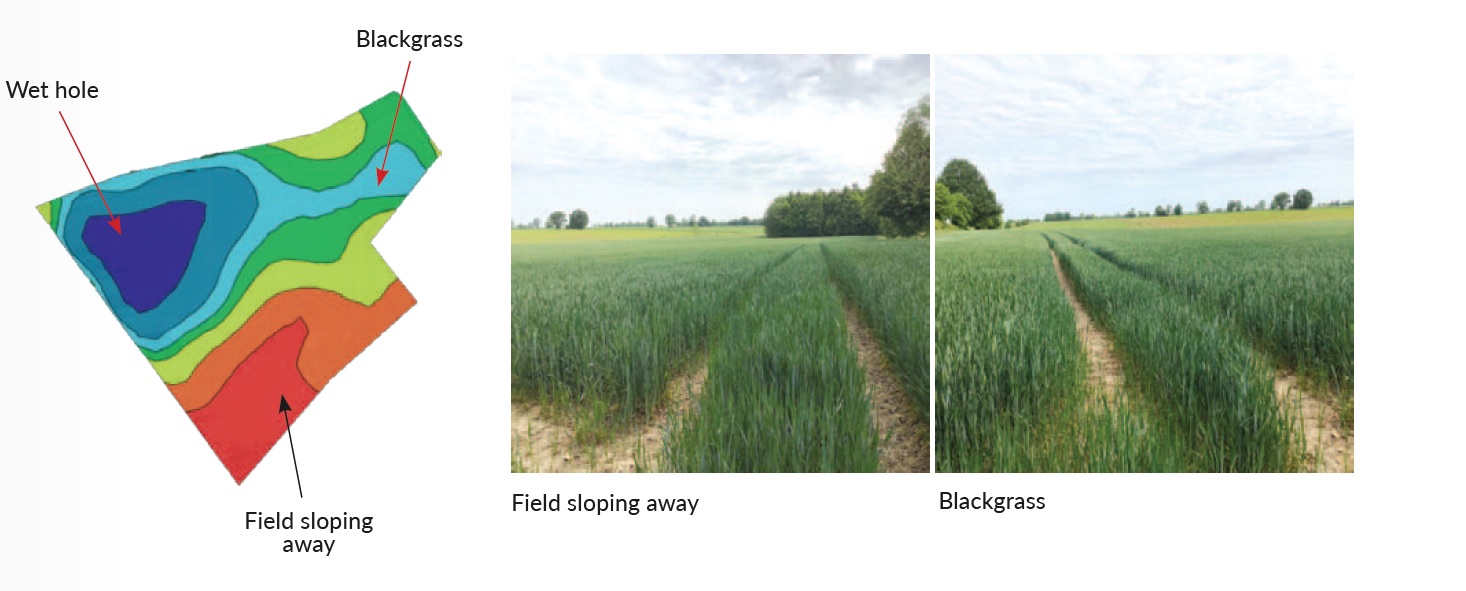
Visual notes from the agronomist and growers
This combination can provide key information regarding zone performance

Obtaining a soil sample from high and low productive areas will provide an accurate indication of soil structure across the field (additional cost). In the example the red areas of the field are sandy clay loam with lower potassium levels and lower pH and the blue areas are clay loam with lower phosphate levels.
This data can be used to compare fields across the farm rather than just variation within the field (additional cost).
Seed rates in the first year are varied in a conservative manner and the most accurate way of providing the best maps is to count establishment percentages in year one. Zones will not change but tweaking rates is very important.